
Chrome Debugger MCP
Connects Claude to Chrome via the DevTools Protocol so you can pause execution at breakpoints, inspect actual scope variables, and step through code with runtime facts instead of guessing from static source. Unlike general browser automation tools, this focuses purely on debugging: attach to a specific tab after user confirmation, wait for debugger statements or CDP breakpoints, read locals and closures from paused frames, evaluate expressions in the current call frame, then resume cleanly. The workflow is opinionated to prevent common agent mistakes like guessing which tab to debug or skipping the wait after reloadPage. Useful when you need Claude to investigate runtime behavior in a live web app rather than reason about code statically.
- GitHub stars
- 1
- tools
- 17
- transport
- STDIO
- last updated
- Mar 16, 2026
Tools
17 toolsPublic tool metadata for what this MCP can expose to an agent.
startDebuggingSessionReturns the recommended debugging workflow and critical rules for agent behavior.
Returns the recommended debugging workflow and critical rules for agent behavior.
No parameter schema in public metadata yet.
launchChromeLaunches a dedicated Chrome instance with remote debugging enabled.
Launches a dedicated Chrome instance with remote debugging enabled.
No parameter schema in public metadata yet.
listTargetsLists available Chrome tabs and requires the user to pick one.
Lists available Chrome tabs and requires the user to pick one.
No parameter schema in public metadata yet.
connectAttaches to the confirmed tab.
Attaches to the confirmed tab.
No parameter schema in public metadata yet.
setBreakpointCreates a CDP breakpoint without modifying source files.
Creates a CDP breakpoint without modifying source files.
No parameter schema in public metadata yet.
removeBreakpointRemoves a breakpoint created by setBreakpoint.
Removes a breakpoint created by setBreakpoint.
No parameter schema in public metadata yet.
reloadPageReloads the current page through CDP.
Reloads the current page through CDP.
No parameter schema in public metadata yet.
waitForSpecificPauseWaits for the next pause and checks whether it matches a target file and line.
Waits for the next pause and checks whether it matches a target file and line.
No parameter schema in public metadata yet.
waitForPauseWaits for any pause without location matching.
Waits for any pause without location matching.
No parameter schema in public metadata yet.
getScopeVariablesReads local, closure, and module scope values from the paused frame.
Reads local, closure, and module scope values from the paused frame.
No parameter schema in public metadata yet.
evaluateExecutes JavaScript in the paused call frame.
Executes JavaScript in the paused call frame.
No parameter schema in public metadata yet.
stepIntoStandard execution control.
Standard execution control.
No parameter schema in public metadata yet.
stepOverStandard execution control.
Standard execution control.
No parameter schema in public metadata yet.
stepOutStandard execution control.
Standard execution control.
No parameter schema in public metadata yet.
resumeResumes execution after inspection.
Resumes execution after inspection.
No parameter schema in public metadata yet.
getStatusNon-blocking polling for connected or paused state.
Non-blocking polling for connected or paused state.
No parameter schema in public metadata yet.
forcePauseRequests a pause at the next JavaScript statement.
Requests a pause at the next JavaScript statement.
No parameter schema in public metadata yet.
Sponsors
 Agent CaffeineSponsoredClose your lid, come back to finished work
 SnugSponsoredThe clipboard manager for the AI eraPromote your product hereReach 125k+ visitors monthly
 WaxSponsoredBlock anything with supervision, without erasing your iPhonePromote your product hereReach 125k+ visitors monthly
 knobsSponsoredSee your site on any phone, any day, in any language
Readme
chrome-debugger-mcp
English
An MCP server for breakpoint-driven Chrome debugging.
chrome-debugger-mcp exposes Chrome DevTools Protocol primitives as MCP tools so an AI agent can attach to a real Chrome tab, pause execution, inspect scope values, evaluate expressions inside the current call frame, and step through code with runtime facts instead of guessing from static source.
It is not a general browser automation server. The focus is runtime debugging.
Core Capabilities
- Attach to a real Chrome tab over CDP after explicit user confirmation
- Pause at breakpoints or
debugger;statements and wait for the exact pause you expect - Read local, closure, and module scope values from the paused frame
- Evaluate JavaScript in the current call frame and step execution forward
- Resume cleanly so the agent can continue with actual runtime values
Demo
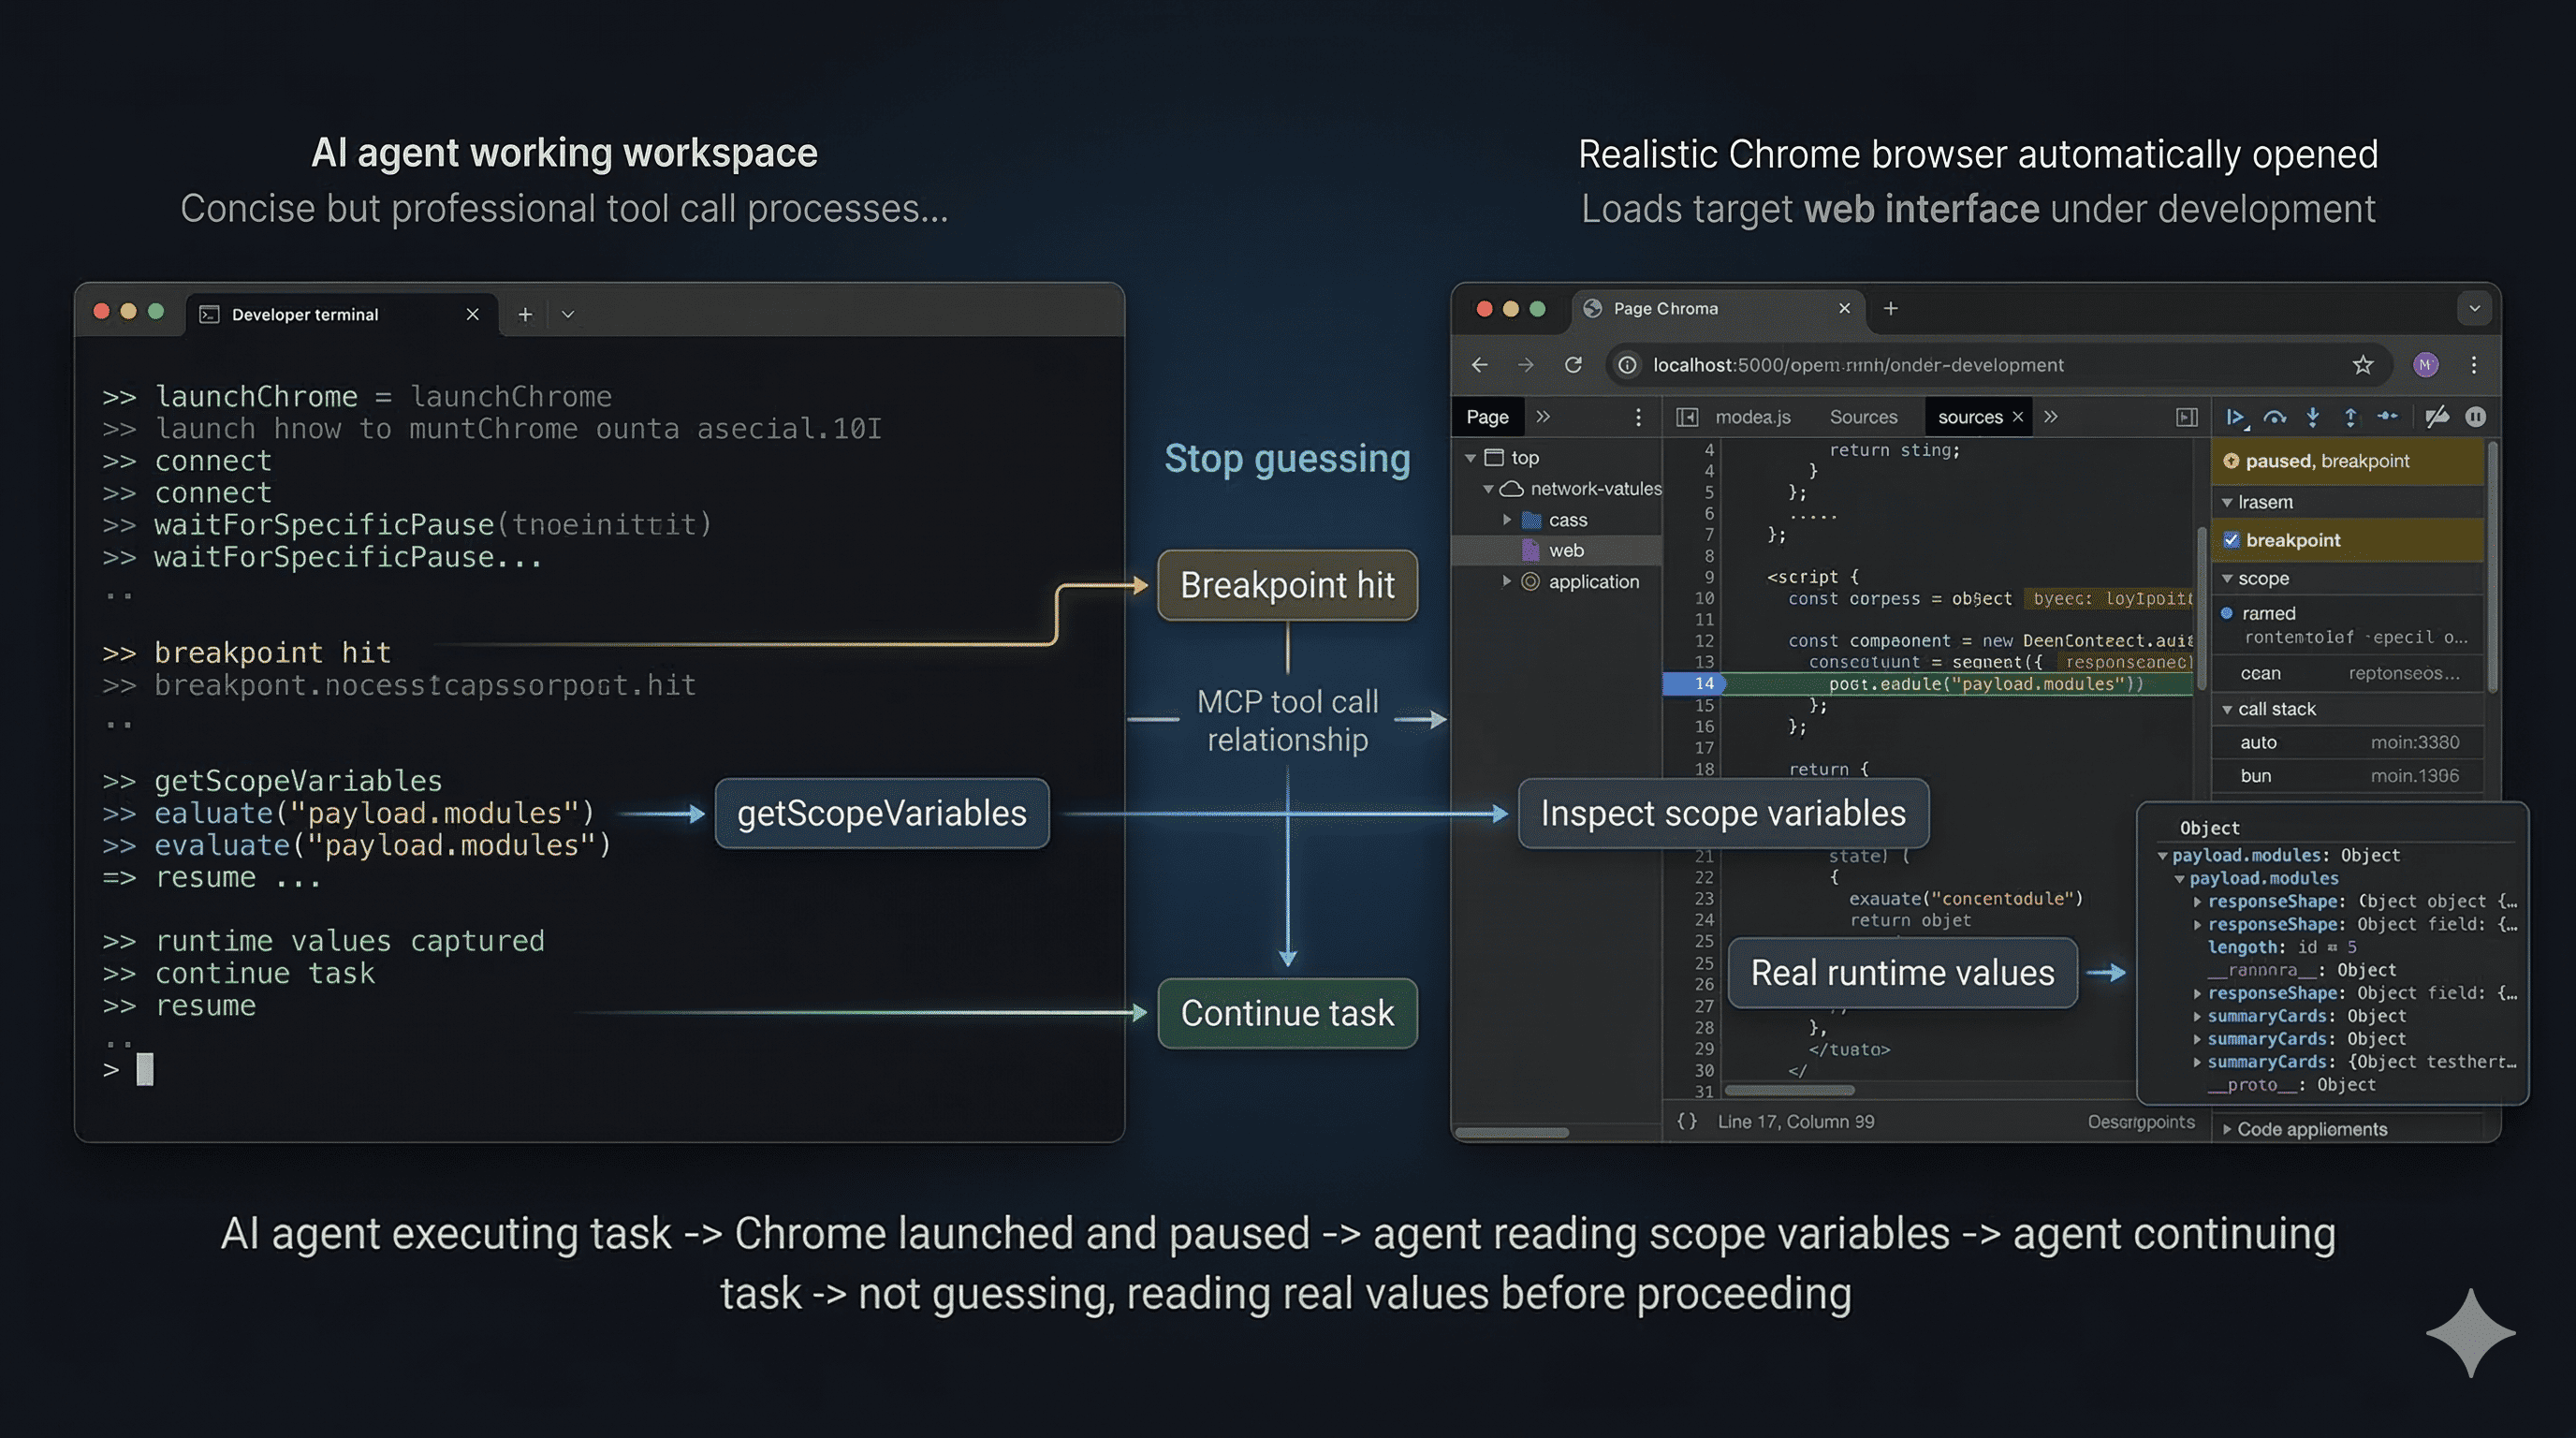
Demo: the agent launches Chrome, waits for a breakpoint, inspects real scope variables, and resumes with runtime facts instead of guessing.
Details
- Repository
- github.com/bitepro/chrome-debugger-mcp
- Category
- Web & Browser Automation
- Package
chrome-debugger-mcp- Transport
- STDIO
- Registry
- MCP registry, active
Related Web & Browser Automation MCP servers
View all MCP Browserbrainfuel/mcp-browserNative macOS browser exposing an MCP server so AI agents can drive a real WKWebView.1stars

 Playwright Spatial Layout Mcpvola-trebla/playwright-spatial-layout-mcpMCP server that gives AI agents geometric spatial awareness of web page layouts using Playwright0stars
 Vessel Browserunmodeled-tyler/vessel-browserAI-native browser runtime for autonomous agents with human-in-the-loop supervision90stars
 HasData Web Scrapinghasdata/web-scraping-mcpFetch any public web page through managed proxies, with optional JS rendering and extraction rules.7stars
 Headless Trackertamaspetki/headlesstrackerRead-only MCP server: your AI sees your crypto portfolio, never your keys. Not financial advice.6stars