
Chart Canvas
Turns your AI conversations into a live visualization dashboard. Exposes tools like addVisualization for creating line, bar, scatter, pie charts, and Mermaid diagrams, plus queryAndVisualize to run SQL against SQLite, CSV, Parquet, and JSON files and instantly chart the results. The data query happens server-side using DuckDB, so only chart configurations go to the LLM, never your actual data. Changes appear in real time in a browser-based drag and drop grid. Reach for this when you're exploring datasets with Claude and want to see charts and tables materialize as you work, or when you need to quickly visualize query results without copy-pasting data around.
- GitHub stars
- 1
- tools
- 6
- transport
- STDIO
- last updated
- Jan 25, 2026
Tools
6 toolsPublic tool metadata for what this MCP can expose to an agent.
addVisualizationCreate charts, diagrams, and tables on the canvas.
Create charts, diagrams, and tables on the canvas.
No parameter schema in public metadata yet.
removeVisualizationRemove a specific visualization by ID.
Remove a specific visualization by ID.
No parameter schema in public metadata yet.
clearCanvasRemove all visualizations from the canvas.
Remove all visualizations from the canvas.
No parameter schema in public metadata yet.
showCanvasOpen the dashboard in your default browser.
Open the dashboard in your default browser.
No parameter schema in public metadata yet.
getDatabaseSchemaInspect the structure of a SQLite database to understand available tables and columns before writing queries.
Inspect the structure of a SQLite database to understand available tables and columns before writing queries.
No parameter schema in public metadata yet.
queryAndVisualizeExecute a SQL query on a SQLite database and create a visualization from the results.
Execute a SQL query on a SQLite database and create a visualization from the results.
No parameter schema in public metadata yet.
Sponsors
 Agent CaffeineSponsoredClose your lid, come back to finished work
 SnugSponsoredThe clipboard manager for the AI eraPromote your product hereReach 125k+ visitors monthly
 WaxSponsoredBlock anything with supervision, without erasing your iPhonePromote your product hereReach 125k+ visitors monthly
 knobsSponsoredSee your site on any phone, any day, in any language
Readme
Chart Canvas MCP Server
Interactive visualization dashboard for AI assistants via Model Context Protocol
Create beautiful charts, diagrams, and tables directly from your AI conversations. Chart Canvas provides a real-time dashboard that displays visualizations as you work with LLMs like Claude.
Demo
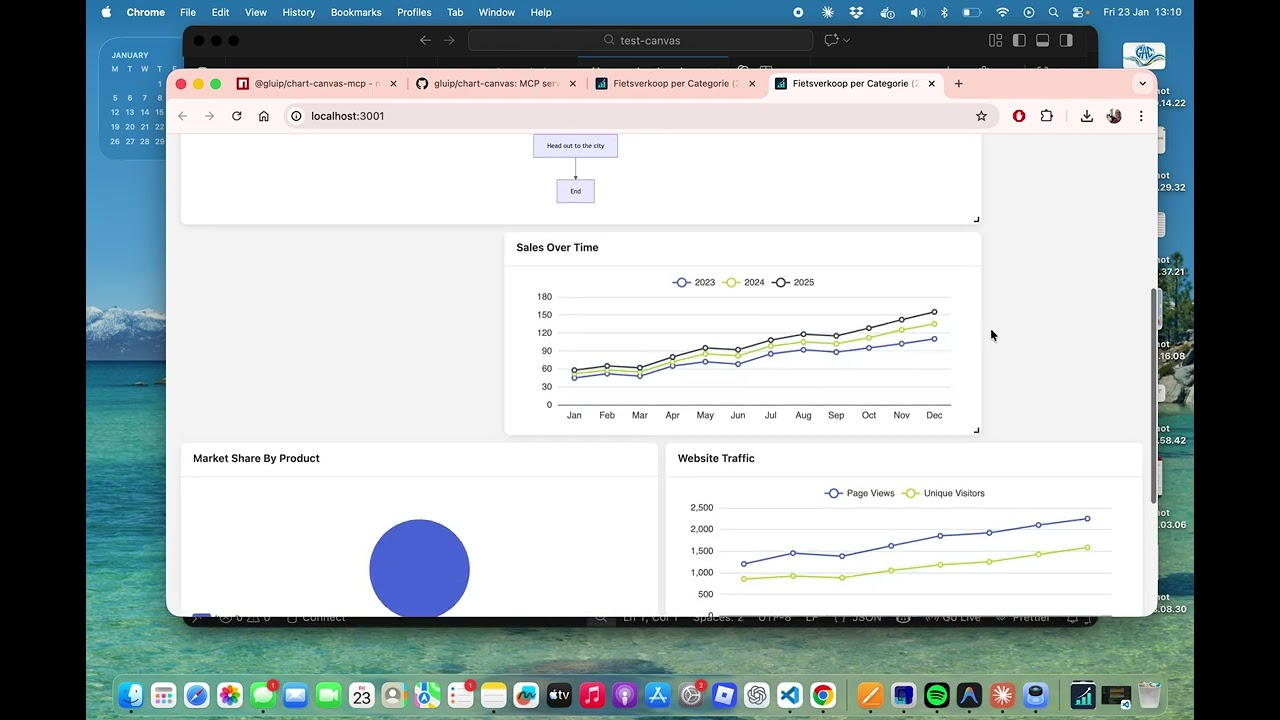
Watch the full demo on YouTube to see Chart Canvas in action!
Features
Details
- Repository
- github.com/gluip/chart-canvas
- Categories
- Databases, Design & Creative, Data & Analytics
- Package
@gluip/chart-canvas-mcp- Transport
- STDIO
- Registry
- MCP registry, active
Related Databases MCP servers
View all memexkioie/memexLocal MCP memory for coding agents. SQLite on your machine — preferences persist across chats.1stars
 TeamMemoryysydhc/team_memoryTeam experience database - let AI accumulate, retrieve and apply team knowledge across chats.1stars
 PySpark MCPannasmazhar/pyspark_mcpSQL migration, AWS Glue job generation, and PySpark optimization as an MCP server.0stars
 Migratorxpress Mcparpe-io/migratorxpress-mcpMCP server for MigratorXpress — cross-platform database migration with parallel transfer0stars
 Aifparyanduntley/aifpDatabase-driven FP enforcement and project management for AI-maintained codebases0stars
 MyAITwinlutolabs/mytwin-mcpA personal RAG database you build from chat, so AI creates work that sounds like you.0stars